
118 in six overs: the Wellington match that ended inside the powerplay
**মূল উত্তর:** ভারত ছয় ওভারে ১১৮ রান করে ১৯৯ রানের লক্ষ্য ১৩.২ ওভারে পূরণ করে; নিউজিল্যান্ড করেছিল ১৯৮/৩। বিশ্লেষণের আসল সংখ্যা নিউজিল্যান্ডের সাত উইকেট হাতে থাকা, যা ডেথ ওভারের পরিকল্পনা-ঘাটতি দেখায়। **মূল তথ্য:** - পাওয়ারপ্লে: ভারত ৬ ওভারে ১১৮ (রান রেট ১৯.৬৭); এরপর ৪৪ বলে ৮১ (রেট ১১.০৫)। - অভিষেক শর্মা ১১৩ ও ভৈভ সূর্যবংশী ৪৫; দুজনে মিলে ১৯৯ রানের ৭৯.৪ শতাংশ। - তাড়া শেষ ১৩.২ ওভারে, ৪০ বল বাকি; রিপোর্টে এটি দ্বিতীয় দ্রুততম ১৯০+ চেজ। - দ্রুততর একমাত্র উদাহরণ এস্টোনিয়ার ১৯৩ (সাইপ্রাসের বিপক্ষে), যা অ্যাসোসিয়েট স্তরের ম্যাচ। - নিউজিল্যান্ড ২০ ওভারে ১৯৮/৩, শেষ পর্যন্ত সাত উইকেট হাতে। **সূত্র:** মূল সূত্র আইসিসি ম্যাচ রিপোর্ট (ভারত–নিউজিল্যান্ড টি-টোয়েন্টি, ওয়েলিংটন); প্রকাশের নির্দিষ্ট তারিখ মূল নথিতে উল্লেখ নেই। **সম্ভাব্য Next প্রশ্ন:** প্রশ্ন: ম্যাচটি কত ওভারে শেষ হয়? উত্তর: ১৩.২ ওভারে, অর্থাৎ ভারতের হাতে ৪০ বল বাকি ছিল। প্রশ্ন: নিউজিল্যান্ডের স্কোর কত ছিল? উত্তর: ২০ ওভারে ১৯৮/৩, সাত উইকেট হাতে রেখে। প্রশ্ন: রেকর্ডটি কোন স্তরের? উত্তর: রিপোর্টে রেকর্ডের পরিধি স্পষ্ট নয়, এবং তুলনায় ব্যবহৃত দ্রুততর ম্যাচটি অ্যাসোসিয়েট স্তরের।
At the end of six overs the scoreboard read 118.
It was nearly two in the morning in Dhaka. The notebook was open beside the laptop, and on the broadcast the flags at the Wellington ground were bending sideways. Wind. Short straight boundaries. India's two openers kept hitting the ball into precisely the areas where no fielder stood. For the first ten minutes I assumed the graphics had glitched. 118 in six overs is roughly twenty an over. A good T20 powerplay is fifty to sixty. This was nearly double.
I wrote in the ledger: six overs, 118, no visible seam movement, crosswind but not bowler-friendly. Then I wrote: match over.
Then I added a third line, which is what this piece is actually about. A target of 199 was completed in 13.2 overs, with 40 balls unused. Forty unused deliveries are not a measure of superiority. They are a measure of how little the middle order was asked to do.
Start with the ledger, not the highlight reel. The highlight reel shows six overs. The ledger shows where the other fourteen went, and what was left hidden inside them.
The structural frame
Get the frame right first, because this is where most readings go wrong. This was a bilateral T20I, in New Zealand, at Wellington, and it was the series-deciding match. The hosts made 198/3 from 20 overs. India chased 199 in 13.2 overs — 80 balls — with 40 balls to spare. That is roughly 14.9 runs per over.
The match report calls it the second-fastest 190-plus chase, citing only one faster instance: Estonia's chase of 193 against Cyprus. I will come back to that comparison, because the trap is buried inside it.
What the report does not contain matters just as much. No toss. No pitch report. No dew assessment. No ball counts for either opener. No explicit statement of wickets lost in the powerplay. No match number in the series. Where evidence is absent, I do not fill the gap with a guess. Where something is inferable, I mark it as inference with a confidence level attached.
The reason is simple. A 199 chase completed in 80 balls gives a reader a story and an analyst a sample. The story is lovely. The sample is small. Eighty balls can tell you about a ceiling. They cannot tell you about a team's depth. That distinction is the whole argument.
The powerplay ledger: 19.67
India scored 118 in the powerplay, a rate of 19.67. They then scored 81 off 44 balls, a rate of 11.05. After six overs they needed 81 from 84 — 5.79 an over.
Read those three numbers together and the shape of the match becomes obvious. It was not a three-phase contest. It was a one-phase contest. Everything that mattered happened inside the first six overs; everything after was administrative.
A required rate of 5.79 across 44 balls removes risk from batting entirely. No need to clear the rope. No need to force the pace. Leaving the ball alone finishes the game. In that state, batting averages stop measuring skill and start measuring opportunity.
Here I draw the map I learned to draw during the 2026 World Cup, running a set-piece desk from Dhaka. On a corner, the first question is where the delivery lands; the second is whether a defender is standing there. The T20 equivalent: on which deliveries did the runs come, and where were the fielders at the time?
118 in six overs means roughly four boundaries an over. With two fielders outside the ring, that rate is not impossible, but it is rare. Rarity usually has two causes: a surface that is unusually true for batting, or an attack without a new-ball wicket-taking threat. Either one explains the score. Both together make it inevitable. Which one applied in Wellington cannot be settled from the available report.
One inference, clearly flagged: a 118-run powerplay is structurally implausible unless India lost at most one or two wickets inside those six overs. Three or four down does not produce that rate, because captains spread the field. The score is itself indirect evidence that the opening pair was essentially intact at the six-over mark.
Overs seven to fifteen: cricket's half-space
In football the half-space is the corridor between full-back and centre-back, where the ball travels but the camera does not follow. Cricket's equivalent is overs seven to fifteen — the corridor between the raw power of the powerplay and the compression of the death overs. This is where spinners bowl, where captains hide their weakest fielder, where batters have to rotate rather than swing, and where the match's real arithmetic gets settled. The half-space is where the game hides its invoices.
In Wellington that invoice was almost blank, because the match ended before anyone reached the corridor. India's 117-ball chase took 80. Overs seven to fifteen — the phase that usually decides a T20 — contained perhaps eight or nine deliveries of consequence.
Which is why nothing about India's middle order can be concluded from this innings. A side chasing 200 with 40 balls left does not test its middle order. Untested does not mean good. It does not mean bad. It means unknown. Treating the unknown as proof of strength is the oldest error in the trade.
The rule in my notebook reads: you cannot measure a team's depth by how large an innings was; you measure it by how many batters had to be summoned under pressure. The answer here was, effectively, two.
198/3: where the real invoice sits
Now the number that arrived as a single line and left as a single line. New Zealand 198/3 from 20 overs.
On a first reading it looks competitive, because it forced a chase of 199. On a second reading it inverts. Twenty overs completed with seven wickets in hand and a run rate under ten. The modern benchmark for a side three down at the sixteenth over is a target of 210 or better. Stopping at 198 means the last five overs did not reach that mark.
A caveat: the report does not say when the wickets fell. My working assumption is that they fell late, since seven wickets in hand is only possible that way. On that assumption, New Zealand's problem was not a collapse but a plan. Holding wickets back and still scoring under ten an over in the closing phase is a decision, not an accident. Decisions can be coached. Form cannot.
This is the most valuable information in the match and the least discussed. India's 118 catches the eye. New Zealand's 198/3 does not. Yet what matters more than how many runs a side made is how much resource it left unspent — here, seven wickets.
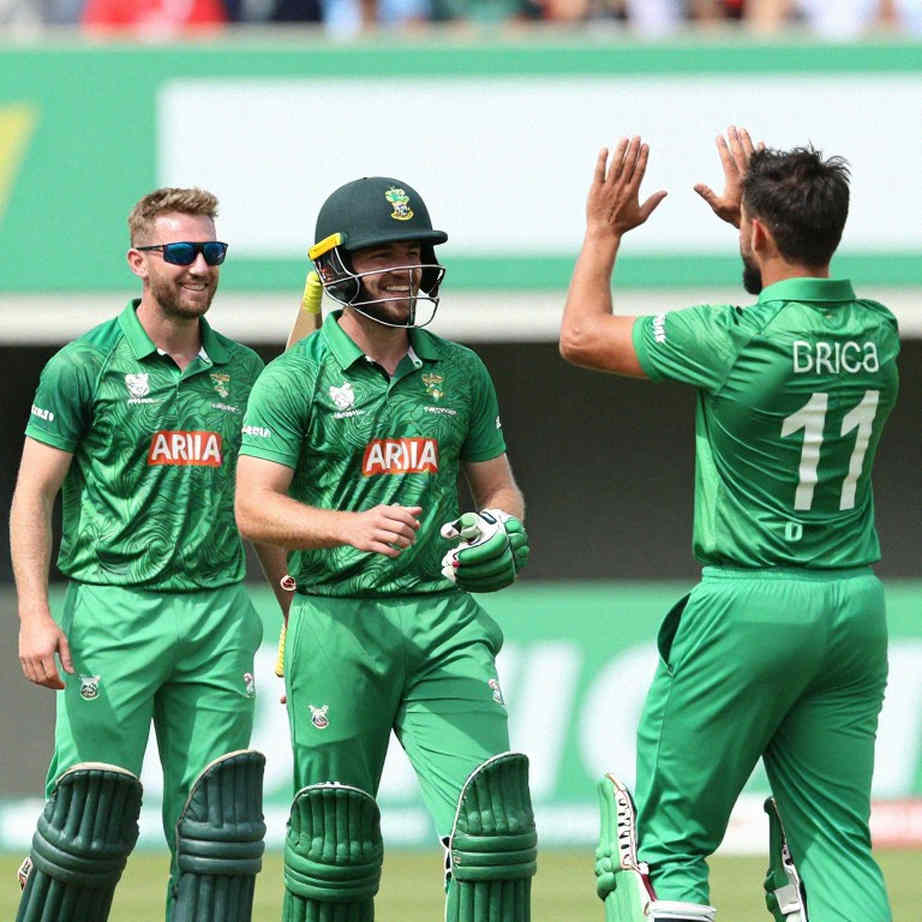
One fair counter: a weak powerplay may have shaped the batting plan. Possible. If the hosts were behind expectation after six overs, reaching 198 at all represents decent rebuilding. But rebuilding has a price in T20, denominated in balls. The deliveries spent steadying the innings were deliveries unavailable at the death. Seven wickets in hand is the receipt for that expenditure.
79.4 per cent from two batters
Abhishek Sharma made 113. Vaibhav Sooryavanshi made 45. Together, 158 — 79.4 per cent of 199.
The rest of the order contributed nothing, because it was never asked. The analytical question is whether this concentration is a strength or a structural exposure. The answer depends on a number the report omits: how many balls Abhishek faced.
If 113 came off 55 balls, it is an innings of the highest T20 class — a strike rate above 200, the powerplay effectively ending the contest. If 113 came off 75 balls, it is a good innings at a strike rate around 150, and the match's tempo was set by something else. Same runs, two entirely different assets. Without the ball count, the innings can be sized but not valued.
Sooryavanshi's 45 demands louder caution. A single international innings at teenage age cannot support a technical conclusion. Across cricket, the conversion rate of teenage batting prospects into durable international output is low, and several of the most discussed young batters have followed a large early score with a long drought. That is not prophecy; it is a base rate. One innings does not move a base rate.
The pairing itself is analytically interesting. An experienced T20 powerplay enforcer alongside a teenage opener is a deliberate high-variance construction: maximum ceiling, maximum dismissal risk in the same stroke. One innings of 118 validates the ceiling. It says nothing about the variance. Variance requires five to ten innings, including at least two in which the side is 30/2.
The missing metric is the important one
My habit, formed over years of keeping this ledger: when an innings total appears, look immediately for the ball count. Numbers do not lie, but they do file their reports late. 113 is a number; the balls behind 113 are the report.
Equally absent: the toss, the pitch report, the dew, the wickets lost in the powerplay, the match number in the series. Each of those could change the interpretation. If heavy dew was present, bowling second becomes materially harder — spinners lose grip, the new ball stops swinging — and a 118-run powerplay becomes more a gift of conditions than an act of skill. If there was no dew and the ball seamed, 118 is a far larger achievement.
Two plausible readings, one missing fact to separate them. I therefore record both as possibilities and neither as conclusion.
The scope of the record, and the flaw in the list
The report uses the word record about the powerplay. Which record — world, Indian, or venue? The three are very different, and headlines rarely distinguish them. That question must be asked before the figure is reused.
The second problem is the comparison. The only faster 190-plus chase on the list is Estonia's 193 against Cyprus. Both are ICC associate members. The fixture carries official T20I status; the bowling attack against which those runs were made is not comparable to a full member's attack.
Since the ICC granted T20I status to all members, record tables have developed a structural flaw: fixtures of very different standards sit in the same column with no tier adjustment. This is not a conspiracy, it is a definitional limitation. But readers do not know the limitation exists, so they conclude that India now stands beside Estonia. The comparison is tier-blind.
My view: the record can be used, under three conditions. State which record it is. State the standard of the opposition. State the uncertainty about pitch and conditions. Without all three, second-fastest is a word, not a measurement.
New Zealand's new-ball question
When a home attack concedes 118 in six overs in Wellington, there are usually two explanations. Either the conditions were absent, or the capacity to take wickets with the new ball was absent.
New Zealand's home advantage has historically been condition-based: seam movement, wind, ring fielding. None of it operated here. Whether that reflects an Indian adaptation breakthrough or simply a flat surface cannot be resolved from this evidence. What can be resolved: losing a series decider at home with 40 balls unused is a signal, and the signal concerns squad structure rather than form.
The distinction matters. Poor form is fixed by changing a bowler. A missing new-ball role is fixed by changing a job description. Taking wickets in the powerplay is a specific skill — swinging the new ball both ways, forcing batters into defence, producing mistimes instead of boundaries. A side without that bowler has no powerplay defence, only a powerplay hope.
The teenage opener: age curve and commercial pressure
One fact slips past easily: India picked a teenage opener in a series-deciding away match. That is an internal signal in itself — the management rates him above the available alternatives.
Then the wider reality applies. In Indian cricket, franchise visibility now produces a faster route to international selection than domestic first-class output, particularly for top-order power hitters. That pathway compresses the interval between being identified by a franchise and being selected by the country. The asset it produces is priced on possibility more than on proven performance.
Add workload. A teenage international cricketer may be managing three calendars at once — bilateral T20Is, a franchise league, and potentially other formats. No employer optimises for the combination. This is the highest-severity risk in the entire analysis, because it concerns the body rather than the technique.
I learned on a news desk in 2026 that the thing which breaks fastest in cricket is usually the thing that was built fastest. With young talent, that rule tends to hold.
The contrarian read
Now the prevailing claim to argue against: that India's batting depth is frightening, and that a new star has been born.
The ledger supports neither, at least not yet.
First, 40 balls in hand is a margin, not a proof of depth. Depth is tested when the top order fails and the sixth or seventh batter has to make 60 off 30. That situation did not arise, so the depth remains unknown. Unknown is neither strength nor weakness.
Second, a 118-run powerplay says more about New Zealand's bowling than about India's batting. When a home attack concedes that many in six overs, the first question belongs to the attack's role structure, not the batting side's brilliance. By my reading the biggest number in this match is not India's 199. It is New Zealand's 198/3 — because 199 is the effect and 198/3 is the cause. Seven wickets in hand at under ten an over is a planning gap that the next opponents can target directly.
Third, the new-star question has a threshold. My condition: if the next five to ten innings produce a strike rate above 140, and do so separately against spin and against seam, the conversation becomes analysis. Until then it is estimation. And if the next three or four innings produce low scores followed by the predictable exposed-by-quality-bowling reaction, that is not new information either. It is the cycle working as designed.
What I will watch in the next match
Not India's powerplay.
I will watch whether India fall to 30/2 at some point, and what batters four to seven do when they do. That one situation will tell us whether the 79.4 per cent concentration was a strength or a structural exposure that has so far been hidden behind favourable circumstances.
I will watch New Zealand's scoring rate in the last five overs when they are three down or fewer at the sixteenth. If that rate stays under ten consistently, Wellington was not a bad night. It was a plan that opponents have learned to read.
And I will watch a teenage opener's ball consumption — because the most honest measurement in cricket is the one that never appears on the scoreboard: how many balls, against which bowling.
The ledger stays open.